
Image Type
Intramedullary T2 Hyperintensity Length (mm or # of vertebral levels)
1) Description of Measurement
Intramedullary T2 hyperintensity length quantifies the longitudinal extent of increased T2 signal within the cervical spinal cord, reflecting edema, demyelination, ischemia, gliosis, or myelomalacia.
In the setting of cervical spondylotic disease, this finding is most commonly associated with degenerative cervical myelopathy (DCM) and correlates with disease severity, chronicity, and neurologic outcomes. The length of T2 signal abnormality provides prognostic information beyond static measures of compression alone.
2) Instructions to Measure
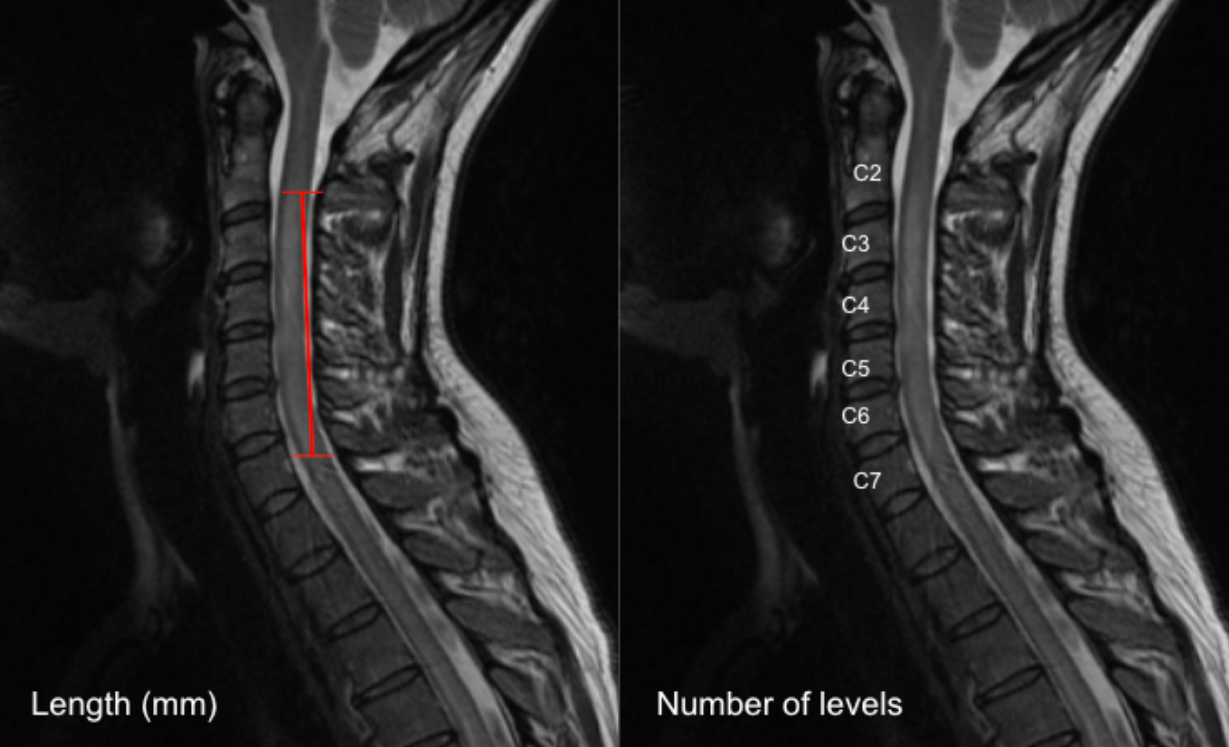
Option A: Linear Measurement (mm)
Select a mid-sagittal T2-weighted MRI slice that best demonstrates the intramedullary hyperintensity.
Identify the cranial (upper) and caudal (lower) margins of the T2 hyperintense signal within the spinal cord.
Using digital calipers, measure the maximum craniocaudal length of the hyperintensity parallel to the long axis of the cord.
Record the length in millimeters (mm).
Option B: Vertebral Level Count
On the same sagittal T2 image, identify the vertebral levels spanned by the hyperintense signal.
Count the number of vertebral body heights or disc levels involved (e.g., “C4–C6 = 2 vertebral levels”).
Partial involvement of a level may be recorded as 0.5 level, if desired.
3) Normal vs. Pathologic Ranges
Normal: Absent/no hyperintensity
Mild cord involvement: ≤ 1 vertebral level or < 10 mm
Moderate cord involvement: 1-2 vertebral levels or 10 - 20 mm
Severe involvement: > 2 vertebral levels or > 20 mm; indicative of chronic myelopathy
Key points:
Longer T2 hyperintensity is associated with worse preoperative neurologic status
Extensive or multilevel signal change correlates with poorer postoperative recovery
4) Important References
Takao T, Morishita Y, Okada S, et al. Clinical relationship between cervical spinal canal stenosis and traumatic cervical spinal cord injury without major fracture or dislocation. Eur Spine J. 2013 Oct;22(10):2228-31. doi: 10.1007/s00586-013-2865-7. Epub 2013 Jun 23.
Tetreault L, Palubiski LM, Kryshtalskyj M, Idler RK, Martin AR, Ganau M, Wilson JR, Kotter M, Fehlings MG. Significant Predictors of Outcome Following Surgery for the Treatment of Degenerative Cervical Myelopathy: A Systematic Review of the Literature. Neurosurg Clin N Am. 2018 Jan;29(1):115-127.e35. doi: 10.1016/j.nec.2017.09.020.
Badhiwala JH, Wilson JR, Fehlings MG. Global burden of traumatic brain and spinal cord injury. Lancet Neurol. 2019 Jan;18(1):24-25. doi: 10.1016/S1474-4422(18)30444-7. Epub 2018 Nov 26.
Yukawa Y, Kato F, Yoshihara H, Yanase M, Ito K. MR T2 image classification in cervical compression myelopathy: predictor of surgical outcomes. Spine (Phila Pa 1976). 2007 Jul 1;32(15):1675-8; discussion 1679. doi: 10.1097/BRS.0b013e318074d62e.
5) Other info....
T2 hyperintensity represents a spectrum of pathology:
Faint, ill-defined signal → potentially reversible edema
Sharp, intense signal → often chronic myelomalacia
Should be interpreted in conjunction with:
Cord cross-sectional area (CSA)
Compression ratio
Maximum spinal cord compression (MSCC)
Canal dimensions
The presence of T1 hypointensity in addition to T2 hyperintensity suggests irreversible cord injury and poorer prognosis
Absence of T2 signal change does not exclude clinically significant myelopathy
Dynamic factors and duration of symptoms strongly influence outcomes and should be considered alongside imaging
Gaillard F, Sharma R, Alwalid O, et al. Longitudinally extensive spinal cord lesion. Reference article, Radiopaedia.org (Accessed on 20 Dec 2025) https://doi.org/10.53347/rID-26463